

Methods & Measures
We use several different methods and measures to get at the questions we explore. Many, if not all, of these methods are indirect in that they get around explicitly asking for answers. These include things like reaction time tasks, mouse-tracking, eye-tracking, facial coding, and psychophysiological measures. Some of these are described in more detail below.
Reaction Time (AKA Implicit Measures)
Reaction time tasks typically involve measuring the speed at which people respond to different classes of stimuli. In doing so, these measures indicate the strength of a person’s association (i.e., their attitude) between mental constructs in memory. There are several types of these measures, including but not limited to:(1) Implicit Association Tests, (2) Priming Tasks of various sorts, (3) Lexical Decision Tasks, (4) Weapons/Shooter Tasks, (5) Affect Misattribution Procedures, and (6) Visual Search Tasks.
Some work from the lab that has used implicit and other reaction time measures:
Olivett, V. J., & March, D. S. (2021). White civilians’ implicit danger evaluation of police officers underlies explicit perception of police. Cognitive Research: Principles and Implications, 6, 81-91. PDF Version.
March, D., S. & Gaertner, L., & Olson, M. A. (2021). Danger or dislike: Distinguishing threat from valence. Journal of Personality and Social Psychology, 121, 984-1004. PDF Version.
March, D., S., Olson, M., A., & Gaertner, L. (2020). Lions, and Tigers, and Implicit Measures, Oh My! Implicit Assessment and the Valence vs. Threat Distinction. Social Cognition, 38, 154-164. PDF Version.
For further reading see: Fazio, R., & Olson, M. (2003). Implicit Measures in Social Cognition Research: Their Meaning and Use. Annual Review of Psychology, 54, 297-327.
Physiological Measures
Physiological measures involve observing and recording a response emanating from within the body that reflects some type of physical reaction. These measures are derived from the measurable properties and functions of human biology. Natively, these measures are informative as health markers; but, when combined with social psychological, and behavioral measures, they can be used to discriminate between responses to different types or classes of stimuli.
Some measures used in the lab:
-
Facial electromyography (fEMG) in combination with noise-blasts can be used as a noninvasive way to index central nervous system activity. The so called startle-eyeblink paradigm measures blink amplitude by recording electrical potential generated by the orbicularis oculi muscle responsible for closing the eye. As an index of amygdala activation (i.e., underlying autonomic activation of unique evaluations), the startle response distinguishes reactions to different classes of stimuli.
-
Skin conductance/electrodermal activity (SCR/EDA) is a method for measuring the electrical conductance of the skin which is used as an index of physiological arousal. Typically, people show increased SCRs to any highly arousing stimulus, whether it be positive or negative in valence.
-
There are other measures, like electrocardiogram (ECG) and heart-rate variability (HRV) that take advantage of the hearts natural responses to index how people react to stimuli; electroencephalography (EEG), which reflect cortical activity that indexes responses in certain surface brain regions; biochemical/genetic markers that give insight into individual difference predispositions and responses.

Some work from the lab that has used physiological measures:
March, D. S., Gaertner, L., & Olson, M. A. (2017). In harm’s way: On preferential response to threatening stimuli. Personality and Social Psychology Bulletin, 43, 1519-1529. PDF Version.
March, D. S., Gaertner, L., & Olson, M. A. (2022). On the automatic nature of threat: Physiological and evaluative responses to survival-threats outside conscious perception. Affective Science, 3, 135-144.
March, D. S. & Graham, R. (2015). Exploring implicit ingroup and outgroup attitudes toward Hispanics. Group Processes and Intergroup Relations, 18, 89-103.
Mouse Tracking
In Mouse tracking studies, participants are exposed to visual stimuli and instructed to categorize a stimulus utilizing a computer mouse. During this categorization, behavior outcomes, errors, as well as reaction times all produce information valuable in understanding online cognition. As physical movement often functions parallel in response to cognition, one may understand mouse tracking as “a way to visualize the path of human thought” by capturing in real-time the behavioral outcome

of processes occuring within the human mind.
Mouse-tracking records x-, y- coordinates of motion when participants choose between response alternatives and provides information, beyond total response time, about the influence of competing alternatives during the decision process. These responses are captured by metrics like Area Under the Curve (AUC), which captures the sum of competition engendered by the distractor across the entire time-course of response.
In addition to the native measures typically included in mouse-tracking packages, I have worked to adapt a growth-curve modeling method often utilized in bacterial growth sciences to demarcate when in time the decision process began. Through this process, I calculate the time of initial correct categorization (TICC), or the point in time when the participant begins moving relatively closer to the target than the distractor. The TICC reflects when the initial automatic response is either or when the initial “incorrect” response is weakened to the point of being overcome. While, AUC plays out over the entire length of the response process and is likely susceptible to other influences (i.e., attempts at control), the lag time reflects initiation of movement toward the correct response as reflecting when in time the decision is made.

Some work from the lab that has used mouse-tracking:
March, D., S. & Gaertner, L., & Olson, M. A. (2021). Danger or dislike: Distinguishing threat from valence as sources of automatic anti-Black attitudes. Journal of Personality and Social Psychology, 121, 984-1004. PDF Version.
March, D., S. & Gaertner, L. (2021). A Method for Estimating the Time of Initiating Correct Categorization in Mouse-Tracking. Behavior Research Methods. 53, 2439-2449. PDF Version.
Eye Tracking
Eye movement is an action that often occurs involuntarily in response to outside stimuli. Such movements are the result of an interaction between perceptual and cognitive processes. Tracking the movement and fixation of the eyes following the presentation of a stimulus allows researchers to index various levels of cognition and track attentional responses to different types of stimuli. Eye tracking can act both diagnostically by quantifying a participant’s visual processes, or interactively, responding to the actions of the participant.

In quantification, we look at things like first-movement, number of fixations, total time spent looking at objects, and where in a scene people actually look. All of these give us insight into how people are processing and responding to a stimulus. In responding, we can actually build logic into the experiment such that what the participant experiences next is dependent on their previous eye movements. In doing so, we can build a flexible and ecologically valid experience.
Some work from the lab that has used eye-tracking:
March, D. S., Gaertner, L., & Olson, M. A. (2017). In harm’s way: On preferential response to threatening stimuli. Personality and Social Psychology Bulletin, 43, 1519-1529. PDF Version.
Facial Coding

As social beings, humans often portray information (e.g., emotion, motivation) through facial muscle movement and facial expressions. Facial Coding is an anatomically derived method for discerning and quantifying various large and minute facial muscle movements. When paired with a stimulus, facial coding quantifies movements of muscles within the face to index emotion or attitude toward a stimulus.
Originally, this method involved manually coding video of participants responding to stimuli (and it often still does for convergent validity). But now we typically use facial coding software to makes the process much quicker and allow us to code many more participants worth of data. Facial coding grants insight into the motivational or dispositional response to whatever the participant is viewing and can be a unique tool for exploring people’s automatic and nonconscious responses.
Balance Board

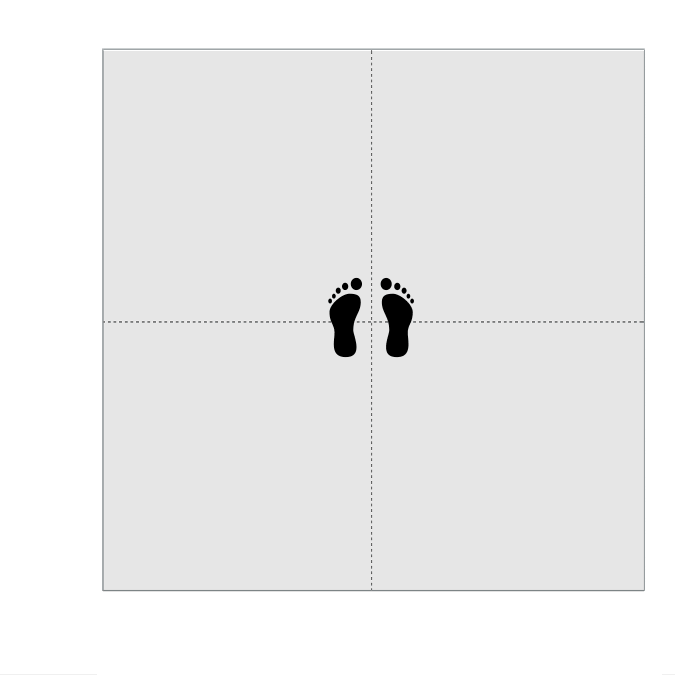
At standing rest, humans exhibit spontaneous shifts in their center of gravity (they exhibit a “postural sway”). A sizable body of literature demonstrates that the magnitude of postural sway is modulated when viewing affective stimuli. In particular, people automatically exhibit a reduced magnitude in postural sway when viewing threatening compared to non-threatening stimuli. In other words, threatening stimuli elicit a defensive freeze response. One way that we (and others) measure affective modulation of postural sway is by continuously recording a participant’s center of pressure image presentations using stabilometric force platforms.
Take a look at the gif to the left. To demonstrate how force platforms work Vinny recorded himself stepping back and forth between the center of the platform and each of its for corners during separate time intervals (coded by color). However, in a typical postural sway task, rather than stepping around, a participant stands still during image presentations, and a freeze response is indexed as the magnitude of sway in the anterior-posterior (forward/backward) plane (AP-SD). Now take a look at the plot below. This depicts a grand mean of sway across 3-second image presentations of police (black line) and non-police (grey). As you can see, participants exhibited defensive freeze responses to police compared to non-police as evidenced by a smaller magnitude of sway in the AP plane.
